
U.S. Corn Enters a Critical Stage as August Weather Becomes the Key Yield Driver
Authored by the American Prime Sustainable Solutions team, with insights and technical feedback from Dr. Jeff Basara
As the U.S. corn crop enters the first half of August, attention is shifting from July heat toward grain fill and yield preservation. According to the latest USDA Crop Progress & Condition Report (released August 3, 2026; data as of August 2, 2026), the national corn crop is now rated 63% Good-to-Excellent conditions, down from 66% the previous week. At the same time, 25% of the corn crop is rated Fair, while 12% is now classified as Poor or Very Poor, reflecting the cumulative impact of prolonged heat and uneven rainfall during late July. Despite this decline, crop development remains slightly ahead of the five-year average in many producing states, making August weather increasingly important for determining final yield potential.
The greatest concern continues to center on portions of the western and central Corn Belt, where repeated periods of high temperatures coincided with pollination and the beginning of grain fill. States including Kansas, Missouri, South Dakota, Nebraska, and parts of Iowa and Minnesota experienced the highest levels of heat stress, although scattered rainfall has created substantial variability between neighboring counties and even adjacent fields. Meanwhile, states such as Illinois, Indiana, Ohio, and Wisconsin have generally maintained stronger crop conditions thanks to more favorable moisture availability, although timely August precipitation will remain critical for protecting kernel weight and grain quality.
With pollination nearing completion across many major producing regions, August weather will largely determine how much of the crop’s remaining yield potential can still be preserved. Cooler temperatures and adequate rainfall can support grain fill and help maximize kernel weight, but they cannot fully reverse stress experienced during flowering. As a result, differences in crop performance are expected to become increasingly localized over the coming weeks, making field-level monitoring more valuable than broad regional averages.
For producers, agronomists, cooperatives, and grain handlers, the next 4 to 5 weeks will be less about whether the crop survives the summer and more about identifying where yield potential is being maintained, where stress is accelerating, and where harvest planning may need to be adjusted. With the USDA’s August Crop Production and WASDE reports approaching, market attention is increasingly focused on how these late-season weather patterns will translate into national production estimates.
U.S. Corn Belt Weather Update: July Conditions and August Outlook
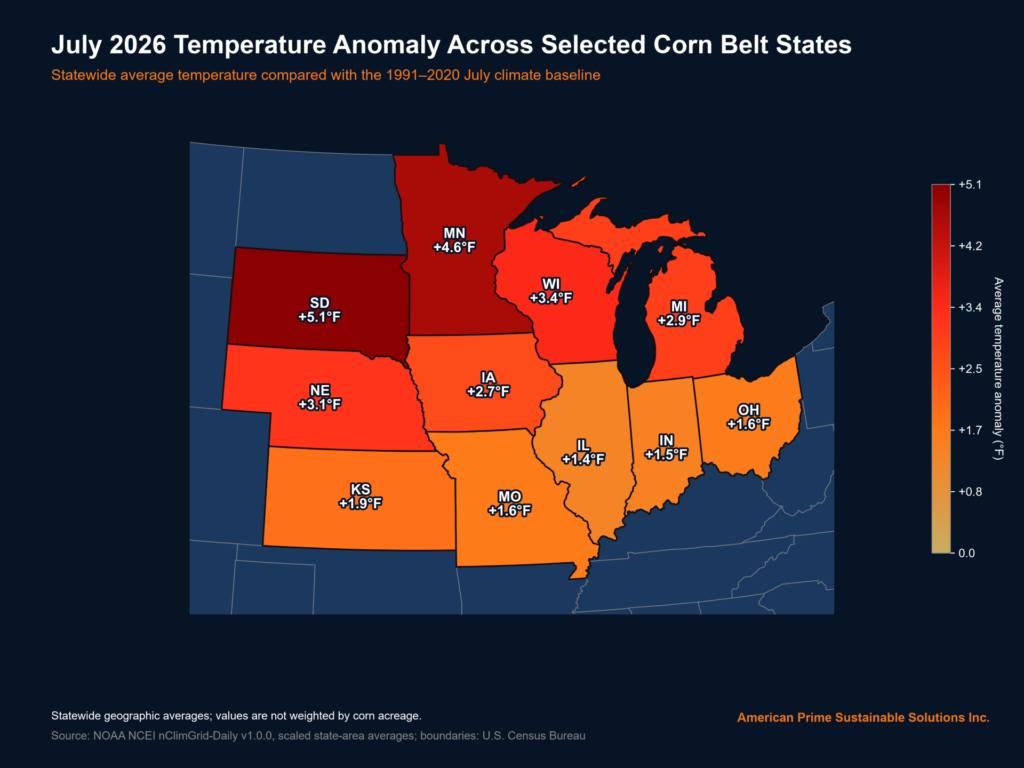
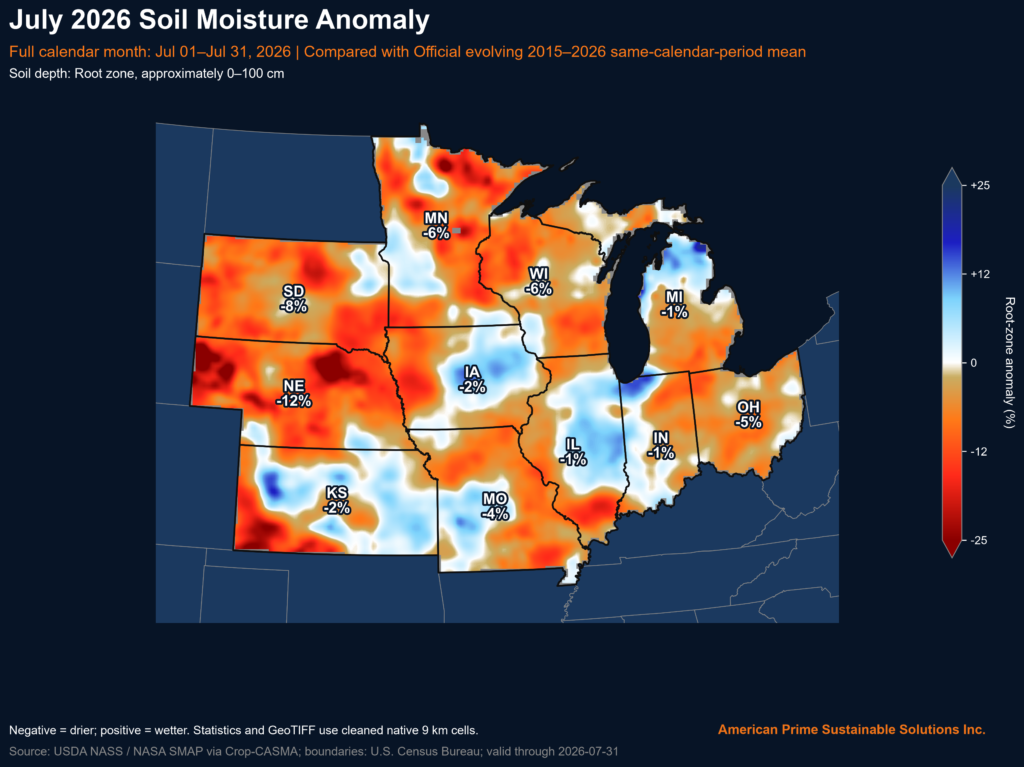
July weather across the U.S. Corn Belt was characterized by persistent above-normal temperatures, high humidity, and highly variable precipitation created by intermittent thunderstorms versus widespread, soaking rainfall. As such, significant differences in soil moisture developed over relatively short distances including at the field scale as some areas received precipitation while others did not. Thus, many areas experienced increased heat and moisture stress that impacted crop development. The most significant heat stress was concentrated in the western Corn Belt, particularly across eastern and central Nebraska, eastern South Dakota, western Iowa, northern Kansas, and western Missouri. These areas experienced the most unfavorable combination of high daytime temperatures, warm overnight lows, and drying soils during corn’s critical pollination period. Elevated nighttime temperatures further increased plant respiration and limited crop recovery between daytime heat events, heightening the risk of yield loss
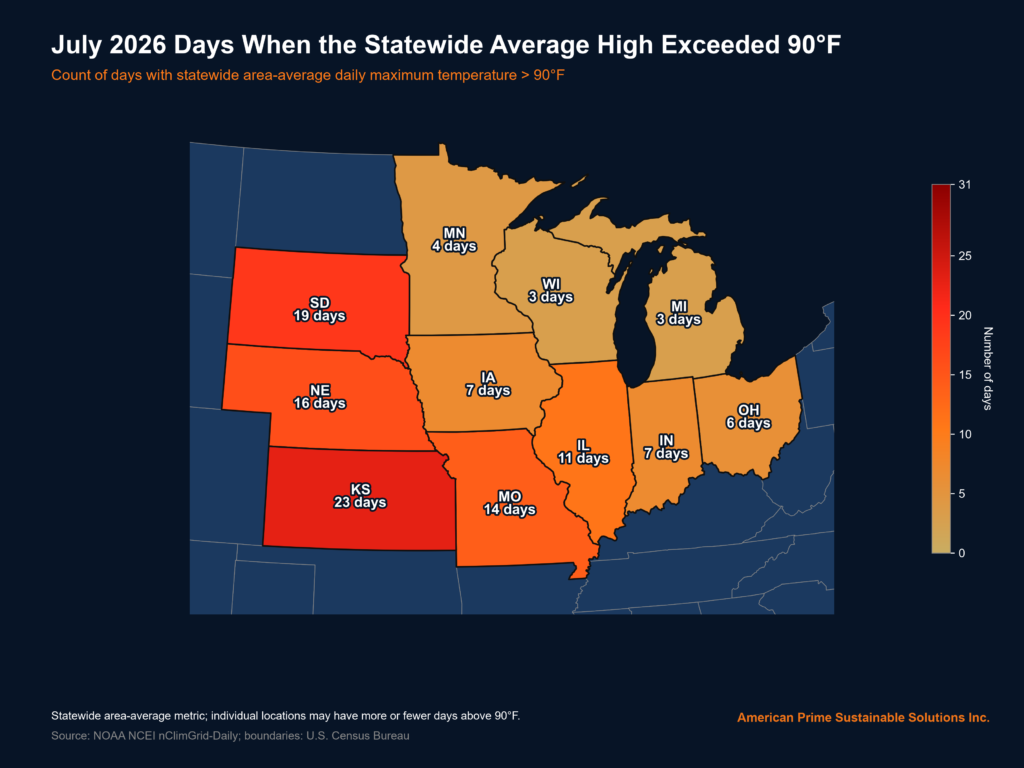
Conditions were somewhat improved across the central Corn Belt. Southern and western Minnesota experienced intermittent periods of heat stress, although periodic rainfall moderated impacts in many locations. Illinois saw frequent hot and humid conditions, but generally adequate soil moisture helped limit widespread crop stress despite elevated heat conditions. The eastern Corn Belt, including Indiana, Ohio, eastern Illinois, and southern Michigan—benefited from more consistent precipitation and entered the latter part of the season with comparatively favorable growing conditions.
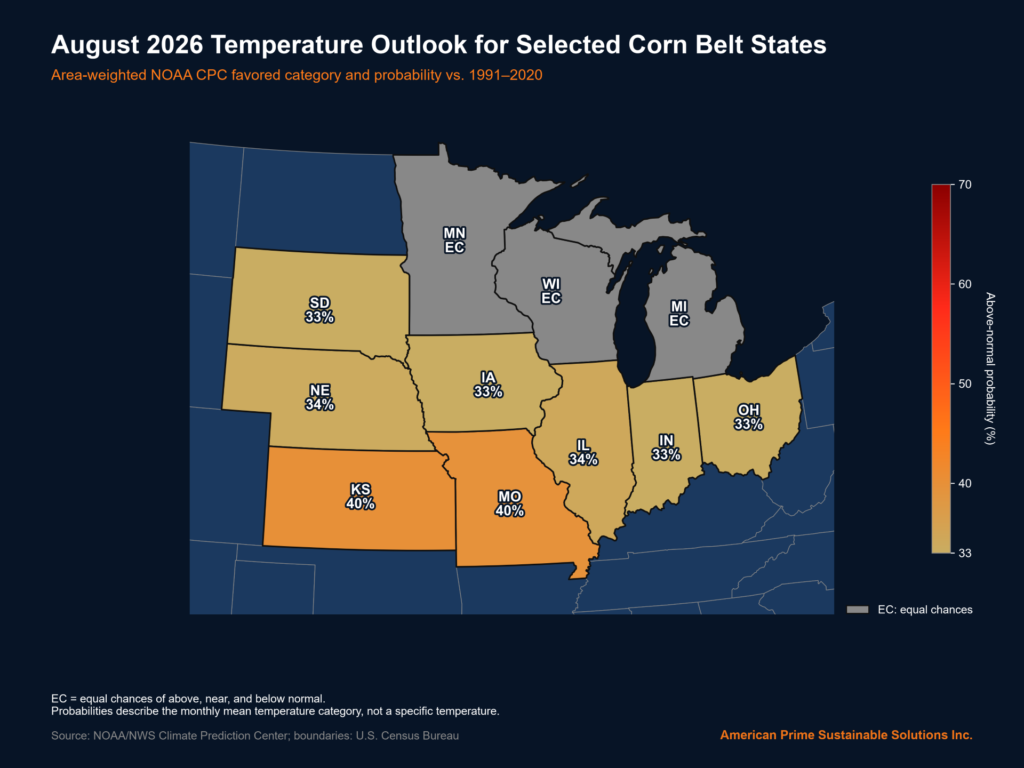
The August outlook continues to favor above-normal temperatures and the potential for increased heat and moisture stress across much of the Corn Belt, supporting elevated evapotranspiration and maintaining relatively high atmospheric moisture demand. While the forecast guidance does not indicate a widespread, extended heat dome, temperatures are expected to remain consistently warm supporting elevated evapotranspiration and maintaining relatively high atmospheric moisture demand.
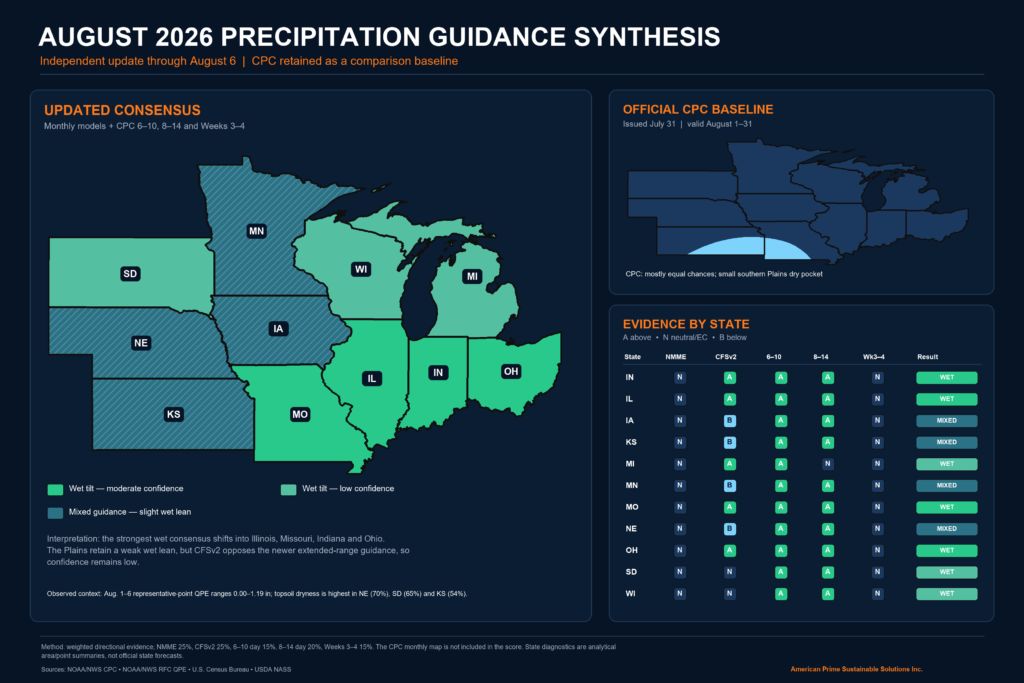
Precipitation forecasts remain less definitive and is expected to continue being driven primarily by scattered thunderstorms with localized heavy downpours and considerable spatial variability. Further, much of the Corn Belt has no strong wet or dry signal thereby increasing the importance of localized storm activity during the grain-fill period.
Why American Prime Users Stay One Step Ahead
For many corn producers, August is one of the most uncertain periods of the growing season. A favorable weather forecast does not necessarily mean a field has recovered from the stress experienced during pollination, while isolated rainfall events can create dramatically different outcomes between neighboring farms, or even adjacent fields. As a result, relying solely on regional weather reports often leaves growers with more questions than answers.
This is where American Prime Sustainable Solutions can bring value. The AP Crop Intelligence platform is built to help agricultural organizations move beyond broad regional crop ratings and understand what is happening at the field level. By combining environmental monitoring with field-level analysis, AP helps users identify developing heat and moisture stress, track changing conditions across multiple fields, and prioritize the areas that may require attention first.
For corn producers and the organizations that support them, that can mean a clearer view of where soil moisture is declining, where crop stress may be accelerating during grain fill, and where scouting, irrigation, harvest, or grain-handling plans may need to be adjusted. It does not eliminate weather risk, and it does not replace agronomic judgment. What it does provide is better visibility during a period when conditions can vary considerably from one field to the next and timely decisions can help protect remaining yield potential. Having timely, field-specific intelligence allows agricultural organizations to respond earlier, make more informed decisions, and navigate late-season uncertainty with greater confidence. When weather conditions become increasingly localized, as they often do during August, understanding what is happening at the field level becomes a meaningful competitive advantage.
Key references:
1) USDA National Agricultural Statistics Service (NASS): Crop Progress & Condition Report
https://esmis.nal.usda.gov/publication/crop-progress
2) USDA NASS – Crop Progress & Condition Reports
USDA – National Agricultural Statistics Service – Charts and Maps – Crop Progress and Condition
3) Weekly Weather and Crop Bulletin
4) Graphic Sources:
https://ftp.cpc.ncep.noaa.gov/GIS/us_tempprcpfcst/monthlyupdate
https://ftp.cpc.ncep.noaa.gov/GIS/us_tempprcpfcst
https://ftp.cpc.ncep.noaa.gov/NMME/prob/netcdf
https://www.cpc.ncep.noaa.gov/products/CFSv2/monthly/data
https://mapservices.weather.noaa.gov/raster/rest/services/obs/rfc_qpe/MapServer
https://www.nass.usda.gov/Publications/National_Crop_Progress
https://www.ncei.noaa.gov/products/land-based-station/nclimgrid-daily
https://www.ncei.noaa.gov/data/nclimgrid-daily/access/averages
https://www.nass.usda.gov/Research_and_Science/Cropland/metadata/metadata_cropcasma.htm
https://nassgeo.csiss.gmu.edu/Crop-CASMA-Developer/wcs/SMAP-9KM-ANOMALY
https://nassgeo.csiss.gmu.edu/Crop-CASMA-Developer/wcs/SMAP-9KM
https://nsidc.org/data/spl4smgp/versions/8
https://www.census.gov/geographies/mapping-files/time-series/geo/cartographic-boundary.html