Weather Risks and the 2026 U.S. Wheat Crop: Insights from the APSS Intelligence Platform
By American Prime Sustainable Solutions Team, July 2026
As the 2026 winter wheat harvest continues across the Southern Plains, a growing number of indicators suggest that U.S. wheat production may fall short of expectations. From persistent drought conditions to reports of lower-than-average yield prospects, the season is increasingly shaped by weather-related challenges that have followed growers from planting through harvest. Recent field observations from the Wheat Quality Council crop tour and harvest reports from Texas, Oklahoma, and Kansas paint a concerning picture. Large portions of the Southern Plains experienced prolonged moisture deficits throughout the growing season and many areas entered spring with depleted soil moisture reserves. In some regions, limited winter precipitation and below-normal snow cover reduced protection against temperature fluctuations and left crops vulnerable to stress as they emerged from dormancy.
The June USDA crop progress data reflects these challenges. Only 26% of the U.S. winter wheat crop is currently rated in good-to-excellent condition, while 44% falls into the poor-to-very-poor categories. The situation is particularly concerning in Texas, Oklahoma, and Kansas, three states that play a critical role in U.S. winter wheat production. According to drought monitoring agencies and industry reports, drought-related abandonment rates have reached exceptionally high levels in parts of the Southern Plains. Yield losses are already being reported in early-harvested fields, while ongoing dryness continues to limit recovery potential in later-maturing areas. In this article, we will use APSS Intelligence Platform and examine conditions across Texas, Oklahoma, and Kansas, explore the weather factors that contribute to winter wheat stress, and focus on regional risks on the country-level.
APSS Insights on Wheat Crop Risks
Weather risk does not affect every wheat field, county, or state in the same way. For hard red winter wheat producers across the Southern Plains, broad climate signals including drought risk, late freeze exposure, and seasonal weather variability are important. But broad weather headlines are not enough. While a regional climate outlook can inform whether risk is present, it does not specific where risk is concentrated, which counties are most exposed, or whether the dominant concern is drought, freeze exposure, vegetation stress, or a combination of all three.
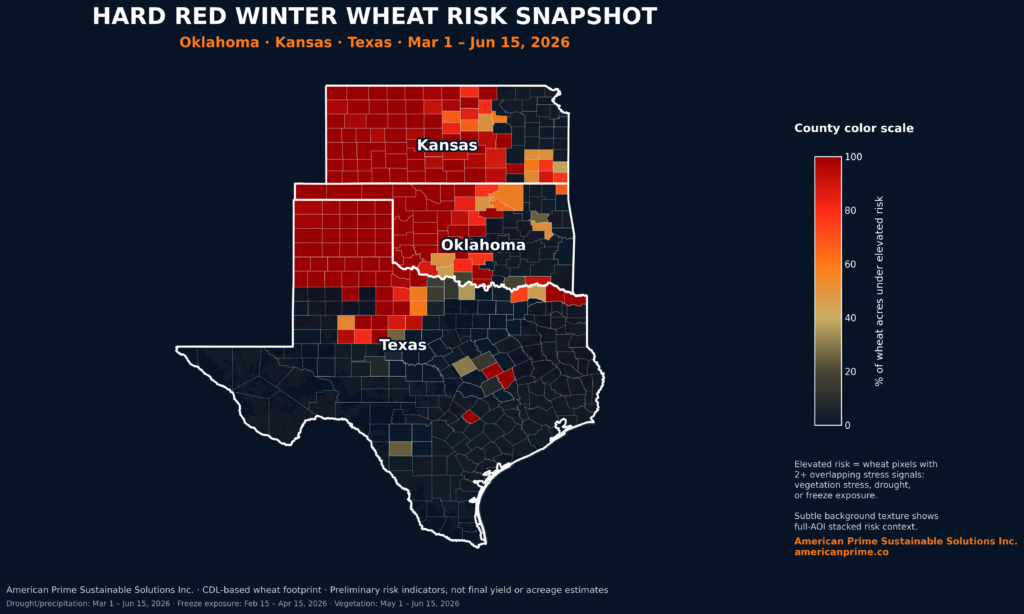
At American Prime Sustainable Solutions Inc., we analyzed CDL-based wheat-associated areas across Oklahoma, Kansas, and Texas using satellite vegetation indicators, spring drought and precipitation signals, and late-winter / spring freeze exposure. The overall goal was not to produce a final yield forecast, but rather to identify where wheat-risk indicators were increasing and where more detailed field-level analysis may be needed. As the APSS Wheat Risk Snapshot Map shows, the county-level wheat risk across Oklahoma, Kansas, and Texas varies depending upon region. County color represents the percentage of CDL-based wheat-associated area flagged by two or more overlapping risk indicators: vegetation stress, drought / precipitation stress, and freeze exposure.
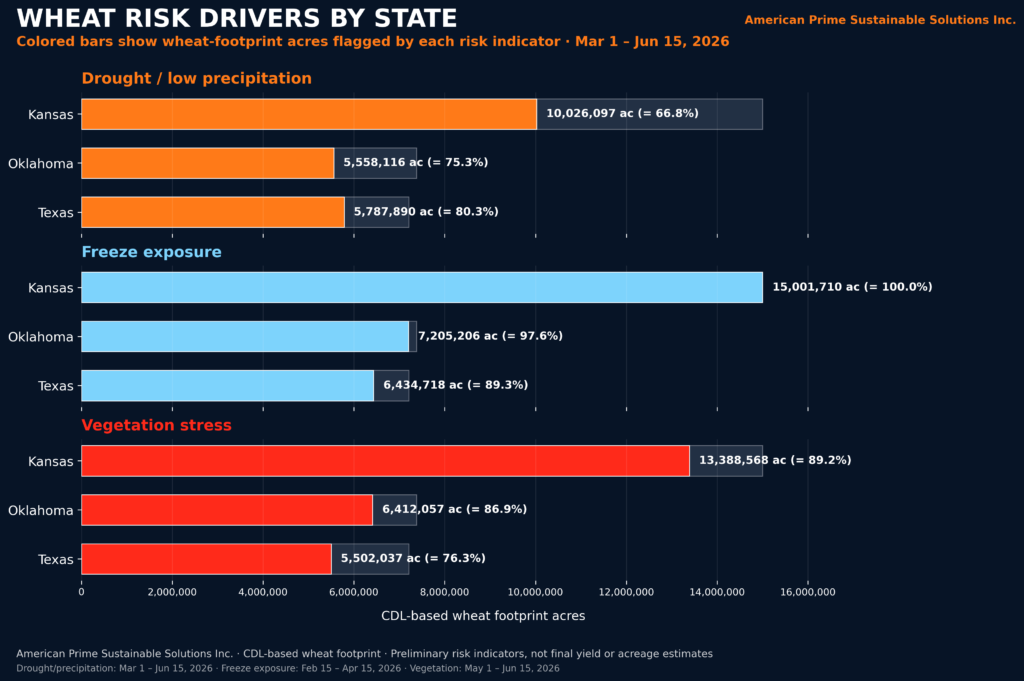
What the analysis shows. The strongest wheat-risk signals were not evenly distributed across the region. They were concentrated in specific counties across the hard red winter wheat belt. In several counties, risk was driven primarily by freezing exposure, while others showed stronger drought / low precipitation signals. Many counties showed multiple stress indicators occurring simultaneously, including vegetation stress, freeze exposure, and drought-related pressure. Overall, that overlap matters, as a producer does not only need to know that the season was dry or that freeze exposure occurred. The more important question is which factor appears to be driving risk in their region. At the state-level comparison of wheat-risk drivers, the colored bars show CDL-based wheat-associated acres flagged by each risk indicator: drought / low precipitation, freeze exposure, and vegetation stress.
Why this matters. Agricultural risk is becoming more complex. Climate variability, including El Niño-related seasonal shifts, can influence broad weather patterns, but local crop outcomes depend on timing, exposure, crop stage, soil moisture, and field-level conditions. This is where geospatial intelligence becomes increasingly valuable – by combining satellite vegetation data, weather exposure, and crop-specific spatial layers, American Prime can help move from broad regional signals to actionable local insights. For producers the APSS resources support scouting and management decisions. For insurers, APSS resources support early risk screening and prioritization. Finally, for lenders and agronomy teams, APSS resources provide a clearer picture of where production risk may be built before final outcomes are known.
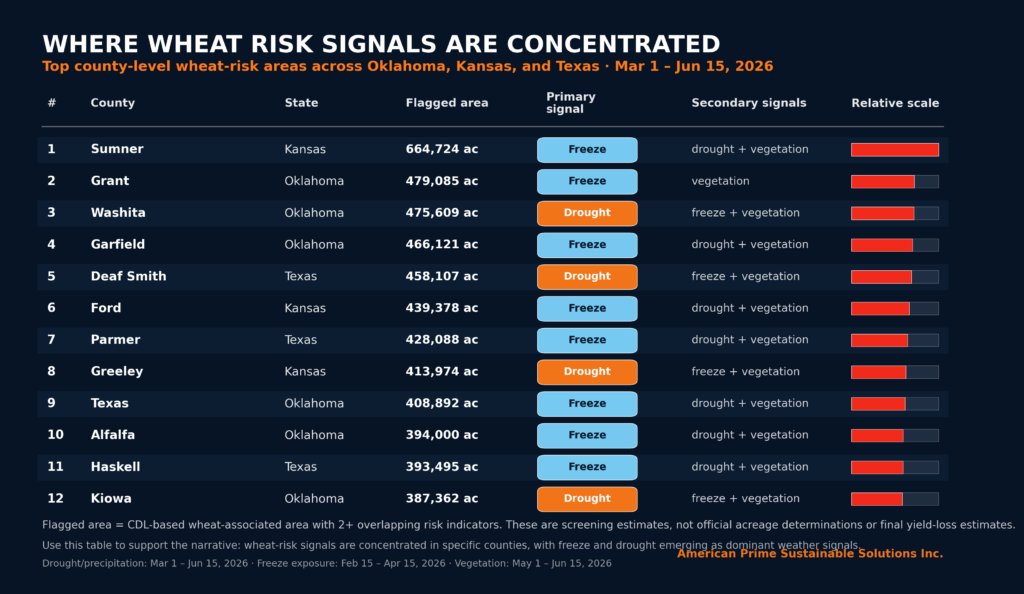
For example, at the country level, via the Country Risk Concentration Table the top counties where CDL-based wheat-associated areas were flagged by overlapping risk indicators. “Flagged area” represents wheat-associated areas with two or more risk indicators present. The primary signal identifies whether freeze, drought, or vegetation stress was the dominant driver in that county. This screening analysis uses CDL-based wheat-associated areas and combines satellite vegetation indicators, spring drought / precipitation conditions, and freeze exposure. The results identify areas where risk indicators overlap, they are not official acreage determinations, insurance loss estimates, or final yield forecasts. As weather volatility continues to affect production systems, producers and agricultural stakeholders need tools that can identify not only where risk exists, but also what is driving it and where action may be needed next. The regional analysis highlights one key conclusion: weather risk is not evenly distributed across the Southern Plains. Understanding where multiple stress factors overlap provides valuable context not only for production decisions, but also for interpreting the market signals that are beginning to emerge.
Price signals and market prospects
The USDA’s June WASDE report reduced the U.S. winter wheat production outlook, with hard red winter wheat output projected at its lowest level since 1957 due to persistent drought across the Southern Plains. The report provided some support to wheat prices, although market gains were limited by ample global grain supplies and higher South American crop estimates. In particular, USDA cut its 2026 U.S. winter wheat production forecast by nearly 2% from May, citing severe drought across the Southern Plains. Total winter wheat output is now expected to be 26% below last year, while hard red winter wheat production is projected to decline by nearly 40% year-on-year. Wheat markets are already sending a clear price signal – wheat futures have strengthened during the first half of 2026, supported by concerns about crop losses in key producing regions and broader weather uncertainty across global grain markets. For growers, this creates a familiar but difficult dilemma: weather risks remain elevated, yet stronger price prospects could improve margins and potentially encourage additional wheat acreage decisions later this year.
While final production outcomes will be available soon, the evidence emerging from the Southern Plains suggests that 2026 may become another reminder of how increasingly variable weather patterns can influence both crop performance and market dynamics.